Blame
| 5bcff3 | deseven | 2025-07-04 20:54:06 | 1 | # Power Modes & Performance |
| 2 | This guide is supposed to show how the performance of the APU changes on various power levels and to help you pick the optimal power mode for your Strix Halo system. |
|||
| 3 | ||||
| d849bc | deseven | 2025-07-05 01:58:15 | 4 | All tests were run at fixed fans speed of 80% to make sure that cooling level is constant, CPU temp never exceeded 75 °C. For GPU becnhmarks please note that the GPU was in a passthrough mode to the Windows VM and only 12 CPU cores were passed as well, so there is at least 5% of a performance drop. In general, look at the percentage changes (relative to the base 55W result). |
| 5bcff3 | deseven | 2025-07-04 20:54:06 | 5 | |
| f793a6 | deseven | 2025-07-06 15:44:19 | 6 | **Everything single-threaded is omitted here, since a single core could never use the full power limit even on the lowest 55W value.** |
| 5bcff3 | deseven | 2025-07-04 20:54:06 | 7 | |
| 8 | ### CPU - PassMark |
|||
| 9 | Details: |
|||
| 10 | - [PassMark PerformanceTest for Linux](https://www.passmark.com/products/pt_linux/download.php), version 11.0.1002 |
|||
| f793a6 | deseven | 2025-07-06 15:44:19 | 11 | - Average of 5 medium tests for CPU, to lower the influence of the initial power boost (`pt_linux_x64 -i 5 -d 2`) |
| 5bcff3 | deseven | 2025-07-04 20:54:06 | 12 | |
| 13 | | Metric | [55W](https://www.passmark.com/baselines/V11/display.php?id=509787657486) | [85W](https://www.passmark.com/baselines/V11/display.php?id=509787842837) | [120W](https://www.passmark.com/baselines/V11/display.php?id=509787902430) | |
|||
| 14 | | ----------------------------------- | ------- | ------- | ------- | |
|||
| d6bb57 | deseven | 2025-07-05 01:22:58 | 15 | | **CPU Mark** | **49 635** | **58 042 <sup style="color: #1fea00; font-size: 0.8em;">+16.9%</sup>** | **62 805 <sup style="color: #1fea00; font-size: 0.8em;">+26.5%</sup>** | |
| 16 | | Integer Math (MOps/s) | 193 409 | 222 270 <sup style="color: #1fea00; font-size: 0.8em;">+14.9%</sup> | 233 483 <sup style="color: #1fea00; font-size: 0.8em;">+20.7%</sup> | |
|||
| 17 | | Floating Point Math (MOps/s) | 107 679 | 127 114 <sup style="color: #1fea00; font-size: 0.8em;">+18.0%</sup> | 138 255 <sup style="color: #1fea00; font-size: 0.8em;">+28.4%</sup> | |
|||
| 18 | | Find Prime Numbers (MPrimes/s) | 263 | 286 <sup style="color: #1fea00; font-size: 0.8em;">+8.7%</sup> | 302 <sup style="color: #1fea00; font-size: 0.8em;">+14.8%</sup> | |
|||
| 19 | | Random String Sorting (kStrings/s) | 71 735 | 88 253 <sup style="color: #1fea00; font-size: 0.8em;">+23.0%</sup> | 98 842 <sup style="color: #1fea00; font-size: 0.8em;">+37.8%</sup> | |
|||
| 20 | | Data Encryption (MB/s) | 33 582 | 40 310 <sup style="color: #1fea00; font-size: 0.8em;">+20.0%</sup> | 44 246 <sup style="color: #1fea00; font-size: 0.8em;">+31.8%</sup> | |
|||
| 21 | | Data Compression (KB/s) | 539 857 | 683 287 <sup style="color: #1fea00; font-size: 0.8em;">+26.6%</sup> | 777 048 <sup style="color: #1fea00; font-size: 0.8em;">+43.9%</sup> | |
|||
| 22 | | Physics (Frames/s) | 4 802 | 5 477 <sup style="color: #1fea00; font-size: 0.8em;">+14.1%</sup> | 5 806 <sup style="color: #1fea00; font-size: 0.8em;">+20.9%</sup> | |
|||
| 23 | | Extended Instructions (MMatrices/s) | 38 464 | 49 404 <sup style="color: #1fea00; font-size: 0.8em;">+28.4%</sup> | 58 761 <sup style="color: #1fea00; font-size: 0.8em;">+52.8%</sup> | |
|||
| dc1f9d | deseven | 2025-07-31 09:21:58 | 24 | \* **all percentage values are relative to the base 55W result** |
| 5bcff3 | deseven | 2025-07-04 20:54:06 | 25 | |
| 26 | ||||
| 5741a8 | deseven | 2025-07-31 09:15:41 | 27 | ### CPU - Various Benchmarks |
| f793a6 | deseven | 2025-07-06 15:44:19 | 28 | Details: |
| 29 | - sysbench - 1.0.20, `sysbench cpu run --threads=32 --time=30` |
|||
| 30 | - cpubench1a - 5.0, `cpubench1a -bench -nb 3 -duration 30` |
|||
| 31 | - 7-Zip - 16.02, `7z b` |
|||
| 32 | ||||
| 33 | | Benchmark (Metric) | 55W | 85W | 120W | |
|||
| 34 | | -------------------------- | --- | --- | ---- | |
|||
| 35 | | sysbench (Events/s) | 85 160 | 96 139 <sup style="color: #1fea00; font-size: 0.8em;">+12.9%</sup> | 99 218 <sup style="color: #1fea00; font-size: 0.8em;">+16.5%</sup> | |
|||
| 36 | | cpubench1a (MT Score) | 3 483 | 4 288 <sup style="color: #1fea00; font-size: 0.8em;">+23.1%</sup> | 4 790 <sup style="color: #1fea00; font-size: 0.8em;">+37.5%</sup> | |
|||
| 37 | | 7-Zip (Compressing MIPS) | 120 759 | 135 008 <sup style="color: #1fea00; font-size: 0.8em;">+11.8%</sup> | 140 471 <sup style="color: #1fea00; font-size: 0.8em;">+16.3%</sup> | |
|||
| 38 | | 7-Zip (Decompressing MIPS) | 103 110 | 124 170 <sup style="color: #1fea00; font-size: 0.8em;">+20.4%</sup> | 135 859 <sup style="color: #1fea00; font-size: 0.8em;">+31.8%</sup> | |
|||
| dc1f9d | deseven | 2025-07-31 09:21:58 | 39 | \* **all percentage values are relative to the base 55W result** |
| f793a6 | deseven | 2025-07-06 15:44:19 | 40 | |
| 5bcff3 | deseven | 2025-07-04 20:54:06 | 41 | |
| 42 | ### GPU - Various Benchmarks |
|||
| 43 | Details: |
|||
| f793a6 | deseven | 2025-07-06 15:44:19 | 44 | - UNIGINE Superposition - DirectX, 1080p Extreme preset |
| 386b81 | deseven | 2025-07-05 01:18:37 | 45 | - 3DMARK Steel Nomad Light - Vulkan, 1080p |
| 46 | - 3DMARK Time Spy - 1080p |
|||
| 5bcff3 | deseven | 2025-07-04 20:54:06 | 47 | |
| 48 | | Benchmark | 55W | 85W | 120W | |
|||
| 49 | | ------------------------ | --- | --- | ---- | |
|||
| d6bb57 | deseven | 2025-07-05 01:22:58 | 50 | | PassMark 2D Mark | 621 | 706 <sup style="color: #1fea00; font-size: 0.8em;">+13.7%</sup> | 758 <sup style="color: #1fea00; font-size: 0.8em;">+22.1%</sup> | |
| 51 | | PassMark DirectX 10 | 59 | 65 <sup style="color: #1fea00; font-size: 0.8em;">+10.2%</sup> | 78 <sup style="color: #1fea00; font-size: 0.8em;">+32.2%</sup> | |
|||
| 52 | | PassMark DirectX 11 | 112 | 134 <sup style="color: #1fea00; font-size: 0.8em;">+19.6%</sup> | 148 <sup style="color: #1fea00; font-size: 0.8em;">+32.1%</sup> | |
|||
| 53 | | PassMark DirectX 12 | 63 | 67 <sup style="color: #1fea00; font-size: 0.8em;">+6.3%</sup> | 80 <sup style="color: #1fea00; font-size: 0.8em;">+27.0%</sup> | |
|||
| 54 | | PassMark GPU Compute | 6 229 | 6 777 <sup style="color: #1fea00; font-size: 0.8em;">+8.8%</sup> | 7 311 <sup style="color: #1fea00; font-size: 0.8em;">+17.4%</sup> | |
|||
| 55 | | UNIGINE Superposition | 5 247 | 6 103 <sup style="color: #1fea00; font-size: 0.8em;">+16.3%</sup> | 6 522 <sup style="color: #1fea00; font-size: 0.8em;">+24.3%</sup> | |
|||
| 56 | | 3DMARK Steel Nomad Light | 8 494 | 9 883 <sup style="color: #1fea00; font-size: 0.8em;">+16.4%</sup> | 10 608 <sup style="color: #1fea00; font-size: 0.8em;">+24.9%</sup> | |
|||
| 57 | | 3DMARK Time Spy | 8 891 | 10 230 <sup style="color: #1fea00; font-size: 0.8em;">+15.1%</sup> | 10 710 <sup style="color: #1fea00; font-size: 0.8em;">+20.5%</sup> | |
|||
| dc1f9d | deseven | 2025-07-31 09:21:58 | 58 | \* **all percentage values are relative to the base 55W result** |
| 5bcff3 | deseven | 2025-07-04 20:54:06 | 59 | |
| 60 | ### GPU - Gaming |
|||
| 386b81 | deseven | 2025-07-05 01:18:37 | 61 | Details: |
| f793a6 | deseven | 2025-07-06 15:44:19 | 62 | - all games use pre-defined presets and built-in benchmarks |
| 63 | - all values are average FPS |
|||
| 64 | - for Metro Exodus ray tracing was additionally set to `normal` |
|||
| 65 | - for GTA5 the value is an average FPS of 5 different benchmarks |
|||
| 66 | ||||
| 67 | | Game | 55W | 85W | 120W | |
|||
| 68 | | ---------------------------------------------- | --- | --- | ---- | |
|||
| 69 | | Cyberpunk 2077 (1080p low) | 61 | 70 <sup style="color: #1fea00; font-size: 0.8em;">+14.8%</sup> | 73 <sup style="color: #1fea00; font-size: 0.8em;">+19.7%</sup> | |
|||
| 70 | | Cyberpunk 2077 (1080p high) | 53 | 62 <sup style="color: #1fea00; font-size: 0.8em;">+17.0%</sup> | 66 <sup style="color: #1fea00; font-size: 0.8em;">+24.5%</sup> | |
|||
| 71 | | The Talos Principle (1080p ultra) | 102 | 113 <sup style="color: #1fea00; font-size: 0.8em;">+10.8%</sup> | 117 <sup style="color: #1fea00; font-size: 0.8em;">+14.7%</sup> | |
|||
| 72 | | Metro Exodus Enhanced Edition (1080p ultra) | 51 | 59 <sup style="color: #1fea00; font-size: 0.8em;">+15.7%</sup> | 63 <sup style="color: #1fea00; font-size: 0.8em;">+23.5%</sup> | |
|||
| 73 | | Red Dead Redemption 2 (1080p high) | 55 | 58 <sup style="color: #1fea00; font-size: 0.8em;">+5.5%</sup> | 66 <sup style="color: #1fea00; font-size: 0.8em;">+20.0%</sup> | |
|||
| 74 | | Grand Theft Auto V Enchanced (1080p very high) | 105 | 118 <sup style="color: #1fea00; font-size: 0.8em;">+12.4%</sup> | 137 <sup style="color: #1fea00; font-size: 0.8em;">+30.5%</sup> | |
|||
| 75 | | Black Myth: Wukong (1080p high) | 71 | 78 <sup style="color: #1fea00; font-size: 0.8em;">+9.9%</sup> | 84 <sup style="color: #1fea00; font-size: 0.8em;">+18.3%</sup> | |
|||
| dc1f9d | deseven | 2025-07-31 09:21:58 | 76 | \* **all percentage values are relative to the base 55W result** |
| 386b81 | deseven | 2025-07-05 01:18:37 | 77 | |
| 78 | ### GPU - LLM |
|||
| f31b63 | deseven | 2025-07-05 01:57:17 | 79 | Details: |
| 80 | - koboldcpp, Vulkan, full GPU offloading |
|||
| 81 | - Q5_K_M |
|||
| 82 | ||||
| 83 | | Model (Metric) | 55W | 85W | 120W | |
|||
| 84 | | ------------------------------------------- | --- | --- | ---- | |
|||
| 85 | | Gemma 3 27B (Prompt Processing, Tokens/s) | 77 | 89 <sup style="color: #1fea00; font-size: 0.8em;">+15.6%</sup> | 95 <sup style="color: #1fea00; font-size: 0.8em;">+23.4%</sup> | |
|||
| 86 | | Gemma 3 27B (Generation Speed, Tokens/s) | 6 | 6 <sup style="font-size: 0.8em;">+0.0%</sup> | 6 <sup style="font-size: 0.8em;">+0.0%</sup> | |
|||
| 87 | | Qwen3 30B A3B (Prompt Processing, Tokens/s) | 92 | 95 <sup style="color: #1fea00; font-size: 0.8em;">+3.3%</sup> | 95 <sup style="color: #1fea00; font-size: 0.8em;">+3.3%</sup> | |
|||
| 88 | | Qwen3 30B A3B (Generation Speed, Tokens/s) | 25 | 29 <sup style="color: #1fea00; font-size: 0.8em;">+16.0%</sup> | 29 <sup style="color: #1fea00; font-size: 0.8em;">+16.0%</sup> | |
|||
| dc1f9d | deseven | 2025-07-31 09:21:58 | 89 | \* **all percentage values are relative to the base 55W result** |
| 5bcff3 | deseven | 2025-07-04 20:54:06 | 90 | |
| 4c9af9 | deseven | 2025-07-06 15:48:13 | 91 | ### Conclusions |
| cf05a6 | deseven | 2025-07-07 10:17:29 | 92 | Let's look on the average increase between different modes for each category: |
| 8534bc | deseven | 2025-07-06 17:03:14 | 93 | |
| 94 | | Category | 55W -> 85W | 85W -> 120W | 55W -> 120W | |
|||
| 95 | | ------------------------ | ---------- | ----------- | ----------- | |
|||
| 96 | | CPU - PassMark | <span style="color: #1fea00;">+19.0%</span> | <span style="color: #1fea00;">+11.8%</span> | <span style="color: #1fea00;">+30.8%</span> | |
|||
| 97 | | CPU - Various Benchmarks | <span style="color: #1fea00;">+17.0%</span> | <span style="color: #1fea00;">+8.5%</span> | <span style="color: #1fea00;">+25.5%</span> |
|||
| 98 | | GPU - Various Benchmarks | <span style="color: #1fea00;">+13.3%</span> | <span style="color: #1fea00;">+11.7%</span> | <span style="color: #1fea00;">+25.0%</span> | |
|||
| 99 | | GPU - Gaming | <span style="color: #1fea00;">+12.3%</span> | <span style="color: #1fea00;">+9.3%</span> | <span style="color: #1fea00;">+21.6%</span> | |
|||
| 100 | | GPU - LLM | <span style="color: #1fea00;">+8.7%</span> | <span style="color: #1fea00;">+2.0%</span> | <span style="color: #1fea00;">+10.7%</span> | |
|||
| 101 | \* **for example, in case of Passmark we have a 19% performance increase when going from 55W to 85W budget and additional 11.8% increase relative to the original 55W performance when going from 85W to 120W, or a 30.8% in total** |
|||
| f793a6 | deseven | 2025-07-06 15:44:19 | 102 | |
| db9be3 | deseven | 2025-07-07 10:58:09 | 103 | Or represented on the chart: |
| 104 | ||||
| 105 | 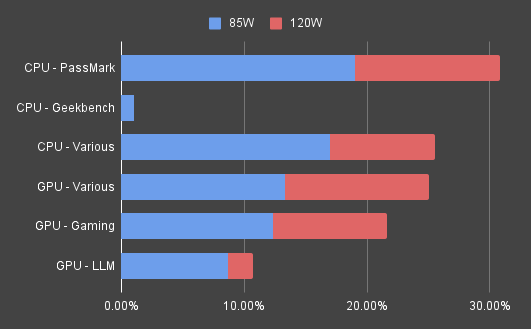 |
|||
| 106 | ||||
| f793a6 | deseven | 2025-07-06 15:44:19 | 107 | A classic situation of diminishing returns, where **85W mode seems to be the sweet spot** and a good compromise between performance gain and power consumption. |
| 108 | ||||
| 5741a8 | deseven | 2025-07-31 09:15:41 | 109 | The 55W mode is suitable if you don't fully utilize your system resources (especially when you don't leverage all cores) or aren't concerned about performance loss. With that said, **55W limit is absolutely enough for the APU in general**. |
| f793a6 | deseven | 2025-07-06 15:44:19 | 110 | |
| 111 | The 120W mode generally doesn't make much sense unless you aim to extract the absolute maximum from your system, with one exception - certain games respond more positively to this increase. My theory is that CPU-heavy games might slightly starve the GPU, so increasing the overall power budget alleviates this issue. Additionally, if you're just shy of reaching 60 fps at 1080p (a reasonable target for this system), this extra power might provide the necessary boost. |
|||
| 112 | ||||
| 113 | For LLMs, memory bandwidth (which APU's power limit doesn't affect) appears to play a more significant role than raw computing power, so again, exceeding 85W offers diminishing benefits. |
|||
| f31b63 | deseven | 2025-07-05 01:57:17 | 114 | |
| f793a6 | deseven | 2025-07-06 15:44:19 | 115 | In summary: |
| 116 | - 55W for light loads (background services, office work, multimedia) |
|||
| 117 | - 120W for intensive gaming sessions |
|||
| 118 | - 85W for mixed workloads and everything else |
|||
| 085a9e | deseven | 2025-07-07 10:09:25 | 119 | |
| fdd688 | deseven | 2025-07-10 15:08:59 | 120 | There is also a way to control power limits more gradually, [[read more here|Guides/Power-Mode-and-Fan-Control#fine-tuning-power-limits]]. |
| 121 | ||||
| 085a9e | deseven | 2025-07-07 10:09:25 | 122 | ### Relevant Pages |
| 123 | - [[Hardware/Boards/Sixunited-AXB35]] |
|||
| fdd688 | deseven | 2025-07-10 15:08:59 | 124 | - [[Guides/Power-Mode-and-Fan-Control]] |